


COACH EDUCATION
Rude Rock began as an outlet to "pay it forward", for all the content and resources we had when we first started. From free resources to paid products, we have everything you need to take your coaching to the next level.
Blog Articles
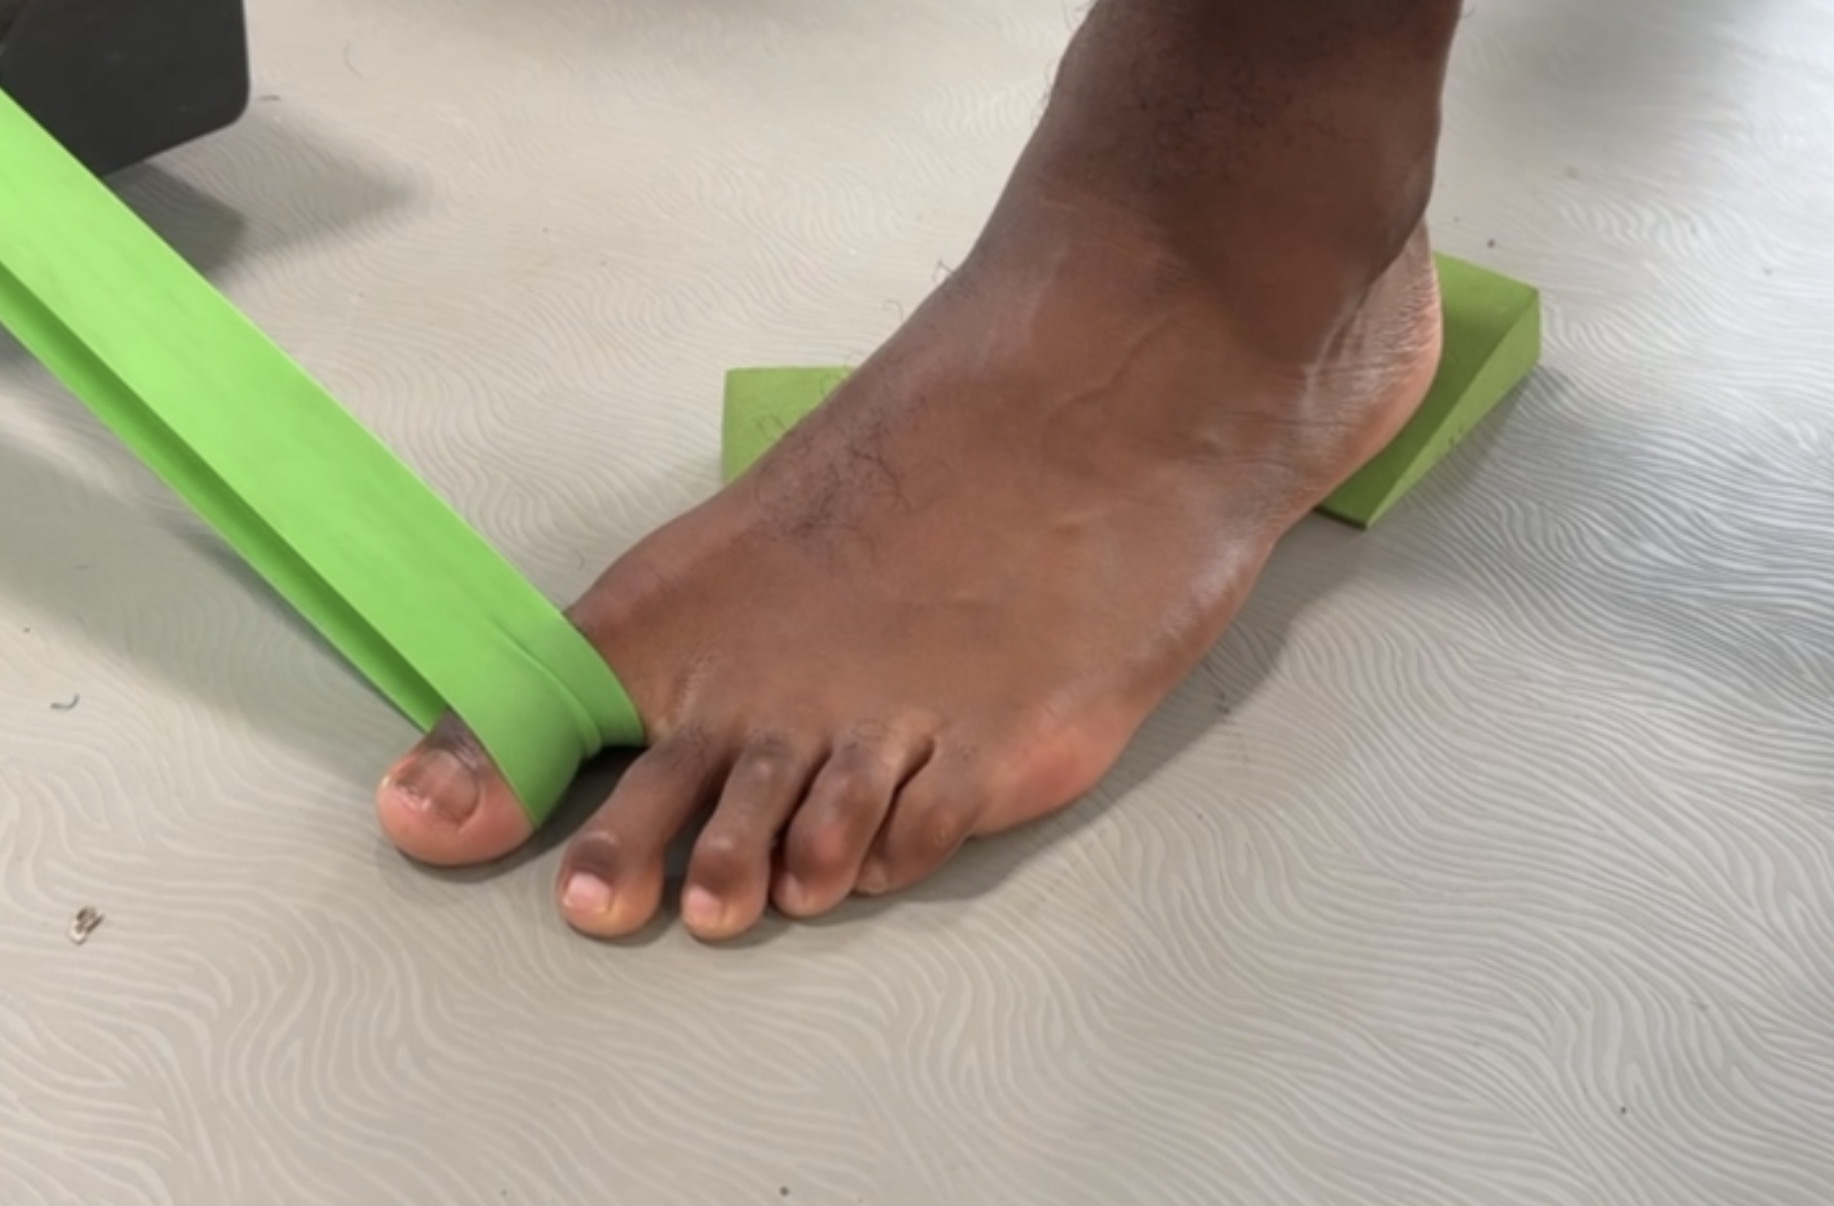
Finding the Limiter in the Foot-Ankle Complex
In the first article of this series, the focus was observation. We used the foot and ankle to answer three basic questions: where is force being applied, how is it being managed, and when is it being expressed? That gives us a useful way to read the contact, but observation is only the beginning. At some point, we still have to answer the more important question: what does it mean, and what are we going to do about it?
This is where the mechanical chain becomes useful. Detection sits at the base, elasticity and rate tolerance sit at the top, and everything in between depends on the layer below it. The six principles are detection, position and pressure, accessible range, bend and compliance, stiffness and strength, and elasticity and rate tolerance. They are not six separate boxes to train in parallel. They operate as one chain, and when the output we want is not there, the limiter usually lives somewhere lower.

A foot cannot bend usefully if it does not have range to bend into. Range does not matter much if pressure cannot be organized through it. Stiffness is less useful if it arrives on top of a contact the athlete does not trust. A flat push-off may not be a propulsion problem. A collapsing arch may not be a mobility problem. A painful plantar fascia may not be a plantar fascia problem in isolation. The point is not to ignore the local tissue. The point is to avoid stopping there.
This also outlines the overarching philosophy we approach performance therapy with- multiple inputs, singular outcome. In other words, we want to collect a wide spectrum of datapoints, interpret them through varying lenses, and leverage the objective and subjective balance to determine our decision making. It’s easy to get pulled off course if we overinvest into single monitoring devices or datasets. Literally any single data point is meaningless without context or complementary inputs- no matter how sophisticated or extensive the data is. Another operating heuristic here- let the subjective observations tell the story of the objective inputs. Let’s break this down further:
We recently had an athlete who began reporting left plantar fascia symptoms during the second week of off-season training. Initially we treated this as an isolated tissue issue, thinking “just one of those little things” that occurred due to training intensity increasing. But as we went along, we started to recognize there were signals sitting underneath it before the symptoms fully announced themselves.
The first signal was reduced dorsiflexion (passive range) on the affected side, comparing to earlier in the year. But in the last year or so, I’ve started analyzing passive range a bit differently. Rather than just capturing the isolated joint-by-joint range and comparing left-right differences, I’ve started to put much more weight into the site range ratio (i.e., L ankle dorsiflexion: plantarflexion ratio). Raw values tell us how much range exists at a single site. Ratios tell us how that range is distributed, and whether one motion is outpacing its partner in a way that changes how the athlete is likely to load.
In this case, the ratio gave us a much clearer distal read. At Combine pre, his ankle DF:PF ratio was 1.00 on the right and 0.56 on the left. At Combine post, the left improved substantially to 0.91. By late-June, however, the right sat at 0.75 while the left had dropped back to 0.45, which was lower than the initial Combine intake profile.

That is a meaningful change. It tells us the left side was not just limited in dorsiflexion. It was drifting toward a more plantarflexion-dominant strategy relative to what we had previously restored. For this athlete, that fit the clinical picture well. He tended to live in resting plantarflexion, the dorsal surface of the foot and the toe extensors were chronically active, and toe flexion capacity was poor. So even before the plantar fascia became the complaint, the distal strategy was already pointing us toward the problem.
Then the week unfolded. Monday of week two brought mild left plantar fascia irritation, although not to the point of limiting the session. But by mid-week, we intervened to off-feet modification after several consecutive days at 2–3/10. Then we had the clearest trigger present at the back end of the week- a pair of cleats he didn’t typically wear immediately provoked the symptoms.
The context here is important, because it’s easy to say looking back that “cleats caused a plantar fascia response.” But that wasn’t the case. Footwear selection affected the status of the tissue by changing the ground interface, but it wasn’t a standalone trigger. By this point, we had reduced passive dorsiflexion range, a significant shift in DF:PF ratio, indicating a shift in strategy, athlete self-reporting (often the strongest signal out of everything) and then we had the cleat situation. So ultimately, the stiffer cleat type altered the ground interaction by changing how load was delivered, and reducing the time the foot had to solve the contact. This became the pivot point for knowing we had to adjust the plan and intervene.
The force data helped clarify it. Peak ankle force was relatively symmetrical. In fact, given enough time, the left side could still produce. But the early window told a different story. Force at 100 milliseconds was down 28% on the left. Impulse at 100 milliseconds showed the same 28% left-sided deficit. So the most useful finding was not a gross max-strength deficit. The most useful finding was that the left foot-ankle complex could produce force eventually, but it could not express force quickly enough in the early part of contact.
The jump data pointed in the same direction. His peak landing force asymmetry had previously been sitting closer to a normal baseline range, roughly 4–7%, and Monday of week two was only a 1.8% right bias. By Wednesday, that had flipped into a 22% left bias, and by Friday it was 23% left. That is effectively a direct 20% swing from Monday to Wednesday. Paired with the field observations, it suggested that the athlete was no longer distributing contact the same way. We were seeing incomplete push-off, avoidance around braking strategies, general offloading of the left side, and a shift toward a right-side bias.
The CMJ rebound profile echoed the same theme without needing to become the entire story. On 7/6, the rebound jump sat at the low point of the block: longer contact time, lower RSI, and more compression. That fit with the symptomatic foot. The system could still produce, but the reactive qualities were not showing up cleanly when the contact window got faster.

Notice the consistent theme here- across all inputs, capacity was not lost, but the ability to express capacity in small time windows was. Most connective tissue impairments are not a capacity problem, they are a rate tolerance problem.
This distinction is critical, especially when connective tissue is involved. With plantar fascia and Achilles-driven issues, the underlying signal is often not peak force. It is the rate at which the tissue has to accept, transmit, and express force. These tissues live in fast windows. When contact gets shorter and the interface gets stiffer, the tissue has to respond before a slower muscular strategy has time to organize the problem. If peak force is available but force at 100 milliseconds and early impulse are not, then the issue is not simply “strength.” It is that the system cannot organize and express force fast enough for the demand being placed on it.
That is a different problem, and it leads to a different intervention.

It also helps us separate capacity from timing. In this case, the left side did not appear to be missing force output altogether. Peak capacity was relatively intact. What was missing was early expression. The athlete could produce force with time, but not quickly enough inside the window the task required. That is a much more useful read than simply labeling it plantar fasciitis and chasing the painful tissue.
This was not a major emergency. It was not a catastrophic injury. It was not a clear shutdown situation. It was a common, practical example of the kind of problem that shows up in real training environments all the time. The athlete had symptoms, but the symptoms were only one piece of the story. The ROM profile gave us a distal strategy. The field work showed how that strategy behaved under load. The ankle ISO gave us the early force expression deficit. The CMJ and CMJ rebound trends supported the larger response pattern. No single signal told the whole story, but together they gave us a much clearer read.
That is the point of evaluating through multiple lenses. We are not trying to collect data just to have more data. We are trying to narrow the decision. Movement observation tells us where the issue appears. Manual screening and range profiling tell us what the athlete can access. Force data helps confirm whether the issue is capacity, timing, or rate tolerance. When those pieces line up, we can stop guessing and start making a better next decision.
In this case, the symptom was left plantar fascia pain. The limiter appeared to be a left foot-ankle system that had regressed distally, was biased toward plantarflexion, was being challenged by a stiffer cleat-ground interface, and could not express force quickly enough in the early loading window. The local tissue still needed support, but the bigger issue was the system underneath it.
This article is part of the Coach’s Foot and Ankle Playbook series, built to help coaches better observe, interpret, and train the foot-ankle complex in real sporting movement. For the full framework, progressions, and coaching applications, check out the Coach’s Foot and Ankle Playbook.

Finding the Limiter in the Foot-Ankle Complex
In the first article of this series, the focus was observation. We used the foot and ankle to answer three basic questions: where is force being applied, how is it being managed, and when is it being expressed? That gives us a useful way to read the contact, but observation is only the beginning. At some point, we still have to answer the more important question: what does it mean, and what are we going to do about it?
This is where the mechanical chain becomes useful. Detection sits at the base, elasticity and rate tolerance sit at the top, and everything in between depends on the layer below it. The six principles are detection, position and pressure, accessible range, bend and compliance, stiffness and strength, and elasticity and rate tolerance. They are not six separate boxes to train in parallel. They operate as one chain, and when the output we want is not there, the limiter usually lives somewhere lower.
A foot cannot bend usefully if it does not have range to bend into. Range does not matter much if pressure cannot be organized through it. Stiffness is less useful if it arrives on top of a contact the athlete does not trust. A flat push-off may not be a propulsion problem. A collapsing arch may not be a mobility problem. A painful plantar fascia may not be a plantar fascia problem in isolation. The point is not to ignore the local tissue. The point is to avoid stopping there.
This also outlines the overarching philosophy we approach performance therapy with- multiple inputs, singular outcome. In other words, we want to collect a wide spectrum of datapoints, interpret them through varying lenses, and leverage the objective and subjective balance to determine our decision making. It’s easy to get pulled off course if we overinvest into single monitoring devices or datasets. Literally any single data point is meaningless without context or complementary inputs- no matter how sophisticated or extensive the data is. Another operating heuristic here- let the subjective observations tell the story of the objective inputs. Let’s break this down further:
We recently had an athlete who began reporting left plantar fascia symptoms during the second week of off-season training. Initially we treated this as an isolated tissue issue, thinking “just one of those little things” that occurred due to training intensity increasing. But as we went along, we started to recognize there were signals sitting underneath it before the symptoms fully announced themselves.
The first signal was reduced dorsiflexion (passive range) on the affected side, comparing to earlier in the year. But in the last year or so, I’ve started analyzing passive range a bit differently. Rather than just capturing the isolated joint-by-joint range and comparing left-right differences, I’ve started to put much more weight into the site range ratio (i.e., L ankle dorsiflexion: plantarflexion ratio). Raw values tell us how much range exists at a single site. Ratios tell us how that range is distributed, and whether one motion is outpacing its partner in a way that changes how the athlete is likely to load.
In this case, the ratio gave us a much clearer distal read. At Combine pre, his ankle DF:PF ratio was 1.00 on the right and 0.56 on the left. At Combine post, the left improved substantially to 0.91. By late-June, however, the right sat at 0.75 while the left had dropped back to 0.45, which was lower than the initial Combine intake profile.
That is a meaningful change. It tells us the left side was not just limited in dorsiflexion. It was drifting toward a more plantarflexion-dominant strategy relative to what we had previously restored. For this athlete, that fit the clinical picture well. He tended to live in resting plantarflexion, the dorsal surface of the foot and the toe extensors were chronically active, and toe flexion capacity was poor. So even before the plantar fascia became the complaint, the distal strategy was already pointing us toward the problem.
Then the week unfolded. Monday of week two brought mild left plantar fascia irritation, although not to the point of limiting the session. But by mid-week, we intervened to off-feet modification after several consecutive days at 2–3/10. Then we had the clearest trigger present at the back end of the week- a pair of cleats he didn’t typically wear immediately provoked the symptoms.
The context here is important, because it’s easy to say looking back that “cleats caused a plantar fascia response.” But that wasn’t the case. Footwear selection affected the status of the tissue by changing the ground interface, but it wasn’t a standalone trigger. By this point, we had reduced passive dorsiflexion range, a significant shift in DF:PF ratio, indicating a shift in strategy, athlete self-reporting (often the strongest signal out of everything) and then we had the cleat situation. So ultimately, the stiffer cleat type altered the ground interaction by changing how load was delivered, and reducing the time the foot had to solve the contact. This became the pivot point for knowing we had to adjust the plan and intervene.
The force data helped clarify it. Peak ankle force was relatively symmetrical. In fact, given enough time, the left side could still produce. But the early window told a different story. Force at 100 milliseconds was down 28% on the left. Impulse at 100 milliseconds showed the same 28% left-sided deficit. So the most useful finding was not a gross max-strength deficit. The most useful finding was that the left foot-ankle complex could produce force eventually, but it could not express force quickly enough in the early part of contact.
The jump data pointed in the same direction. His peak landing force asymmetry had previously been sitting closer to a normal baseline range, roughly 4–7%, and Monday of week two was only a 1.8% right bias. By Wednesday, that had flipped into a 22% left bias, and by Friday it was 23% left. That is effectively a direct 20% swing from Monday to Wednesday. Paired with the field observations, it suggested that the athlete was no longer distributing contact the same way. We were seeing incomplete push-off, avoidance around braking strategies, general offloading of the left side, and a shift toward a right-side bias.
The CMJ rebound profile echoed the same theme without needing to become the entire story. On 7/6, the rebound jump sat at the low point of the block: longer contact time, lower RSI, and more compression. That fit with the symptomatic foot. The system could still produce, but the reactive qualities were not showing up cleanly when the contact window got faster.
Notice the consistent theme here- across all inputs, capacity was not lost, but the ability to express capacity in small time windows was. Most connective tissue impairments are not a capacity problem, they are a rate tolerance problem.
This distinction is critical, especially when connective tissue is involved. With plantar fascia and Achilles-driven issues, the underlying signal is often not peak force. It is the rate at which the tissue has to accept, transmit, and express force. These tissues live in fast windows. When contact gets shorter and the interface gets stiffer, the tissue has to respond before a slower muscular strategy has time to organize the problem. If peak force is available but force at 100 milliseconds and early impulse are not, then the issue is not simply “strength.” It is that the system cannot organize and express force fast enough for the demand being placed on it.
That is a different problem, and it leads to a different intervention.
It also helps us separate capacity from timing. In this case, the left side did not appear to be missing force output altogether. Peak capacity was relatively intact. What was missing was early expression. The athlete could produce force with time, but not quickly enough inside the window the task required. That is a much more useful read than simply labeling it plantar fasciitis and chasing the painful tissue.
This was not a major emergency. It was not a catastrophic injury. It was not a clear shutdown situation. It was a common, practical example of the kind of problem that shows up in real training environments all the time. The athlete had symptoms, but the symptoms were only one piece of the story. The ROM profile gave us a distal strategy. The field work showed how that strategy behaved under load. The ankle ISO gave us the early force expression deficit. The CMJ and CMJ rebound trends supported the larger response pattern. No single signal told the whole story, but together they gave us a much clearer read.
That is the point of evaluating through multiple lenses. We are not trying to collect data just to have more data. We are trying to narrow the decision. Movement observation tells us where the issue appears. Manual screening and range profiling tell us what the athlete can access. Force data helps confirm whether the issue is capacity, timing, or rate tolerance. When those pieces line up, we can stop guessing and start making a better next decision.
In this case, the symptom was left plantar fascia pain. The limiter appeared to be a left foot-ankle system that had regressed distally, was biased toward plantarflexion, was being challenged by a stiffer cleat-ground interface, and could not express force quickly enough in the early loading window. The local tissue still needed support, but the bigger issue was the system underneath it.
This article is part of the Coach’s Foot and Ankle Playbook series, built to help coaches better observe, interpret, and train the foot-ankle complex in real sporting movement. For the full framework, progressions, and coaching applications, check out the Coach’s Foot and Ankle Playbook.
YouTube
Share Our YouTube Channel



Movement Literacy Concepts - Kinetic [02:16]
The final piece of our movement literacy framework addressing...

Trunk & Spine [01:40]
Basic spinal mechanics and how they relate to movement...

Movement Literacy - Hips [02:13]
Addressing the basics of hip movement in our framework...

Movement Literacy - Foot [01:49]
Part 1 of our movement literacy framework covering mechanics...

Shoulder Mechanics [01:46]
Fourth segment covering basic shoulder mechanics...

Trunk/Bracing [03:36]
Learn key trunk bracing techniques for safe movement...

Shoulder/Scapula [02:32]
Scapula mechanics and shoulder stability fundamentals...

Movement Literacy [02:57]
An overview of essential movement literacy concepts...
Optimizing Feet & Ankles [01:37]
Techniques to improve foot and ankle performance...
Foot & Ankle Coaching [02:02]
Effective coaching and cueing for foot and ankle...

Basic Foot & Ankle Functions [02:28]
Understanding the fundamental functions of foot and ankle...

Cueing & Coaching the Neck [02:24]
Learn neck movement and coaching strategies...

Human First Newsletter
Human First is a weekly note on the parts of high performance that have nothing to do with training leadership, decision-making, self-awareness, and navigating the demands of work and life with more clarity and intent.
Our technical coaching, rehab, and athlete-management content still lives on the website; this is where we think out loud about everything around it.
©2026 Rude Rock Strength and Conditioning, LLC